Work
Influenced by an early life of journalism and photography, the software I enjoy building is a mixture of interfaces that experiment, and interfaces that teach. I’m most interested in work that allows me to ask questions of the overlap between art and science. I’ll always be a child of the open web. The work here is a sample of both professional and hobby projects. If curious you can read more about me and how I think about software.
Parade SF
parade-sf.comDescription
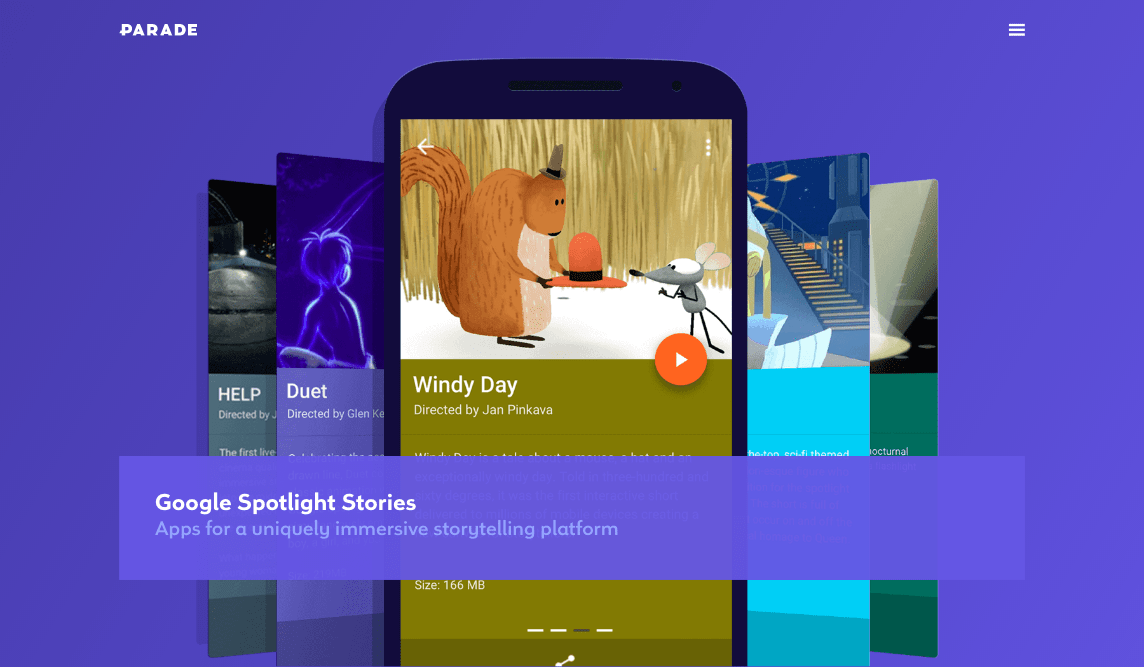
I led development alongside the designers at Parade to help build a new website for their design firm. Craft CMS gives a powerful architecture, while allowing us to build all UI's from scratch. Optimizing animations on the homepage allowed us to really bring the site alive.
Technology
- Craft CMS, MAMP stack
- CSS and jQuery for animation
- SASS and boostrap grid system that allowed us to build 3 customized styles for different screen sizes
- Asset optimization: SVG, device, specific load

Riverdale Athletics
Website unavailable riverdaleathletics.ca
Description
Built and designed Riverdale Athletics, with the goal of having a simplified one-page landing with clean info and actions. Specifically built with the understanding that the vast majority of users will come from mobile viewports.
Technology
- Uses the lightweight Jekyll generator to serve up static pages
- For a quick and easy grid system Bootstrap was used
Get Issues
get-issuesDescription
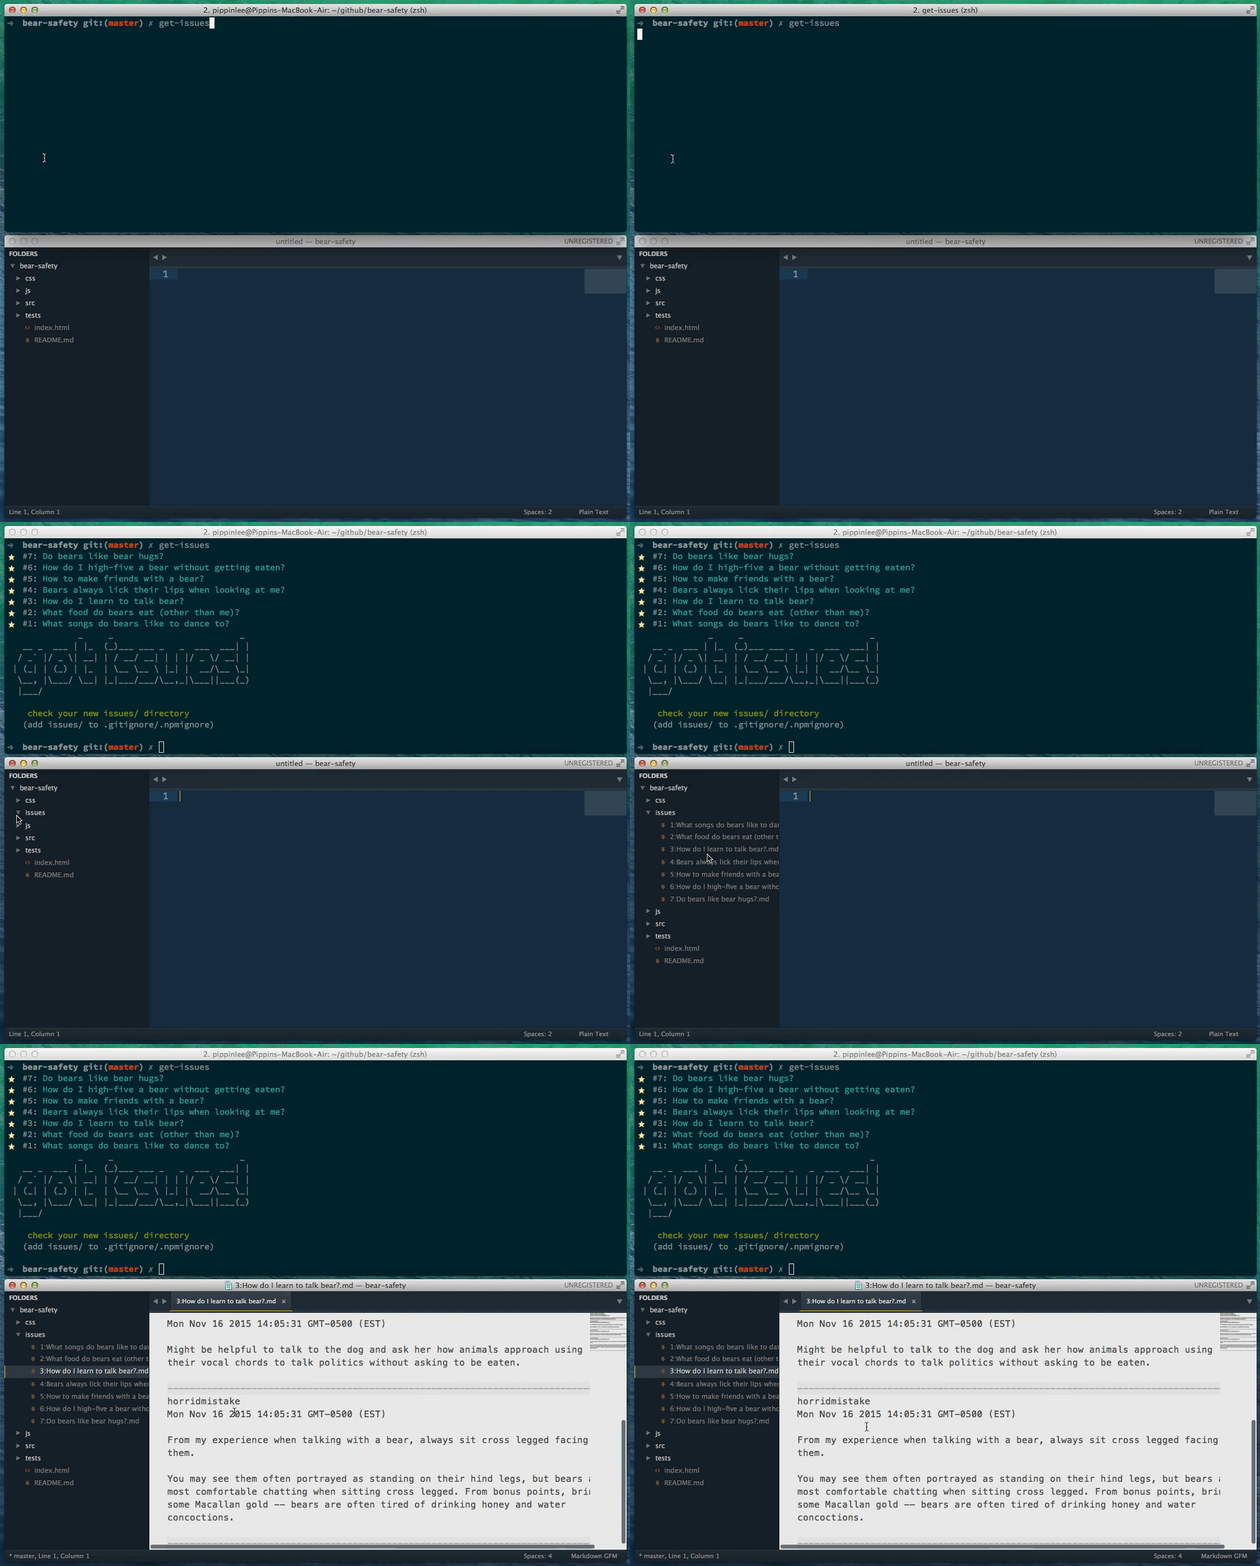
A small command line tool I built to be the fastest way to get Github issues offline. It can be run in any local Github repo, and downloads all open issues, includes markdown syntax. I initially built this help me better understand Node's async.waterfall.
Technology
- Uses Node.js as a simple way to make a CLI
- Github API to get any open issues
- Additional command line flow if user has 2-factor authentication setup on Github
Holy Mackinaw
holy-mackinawDescription
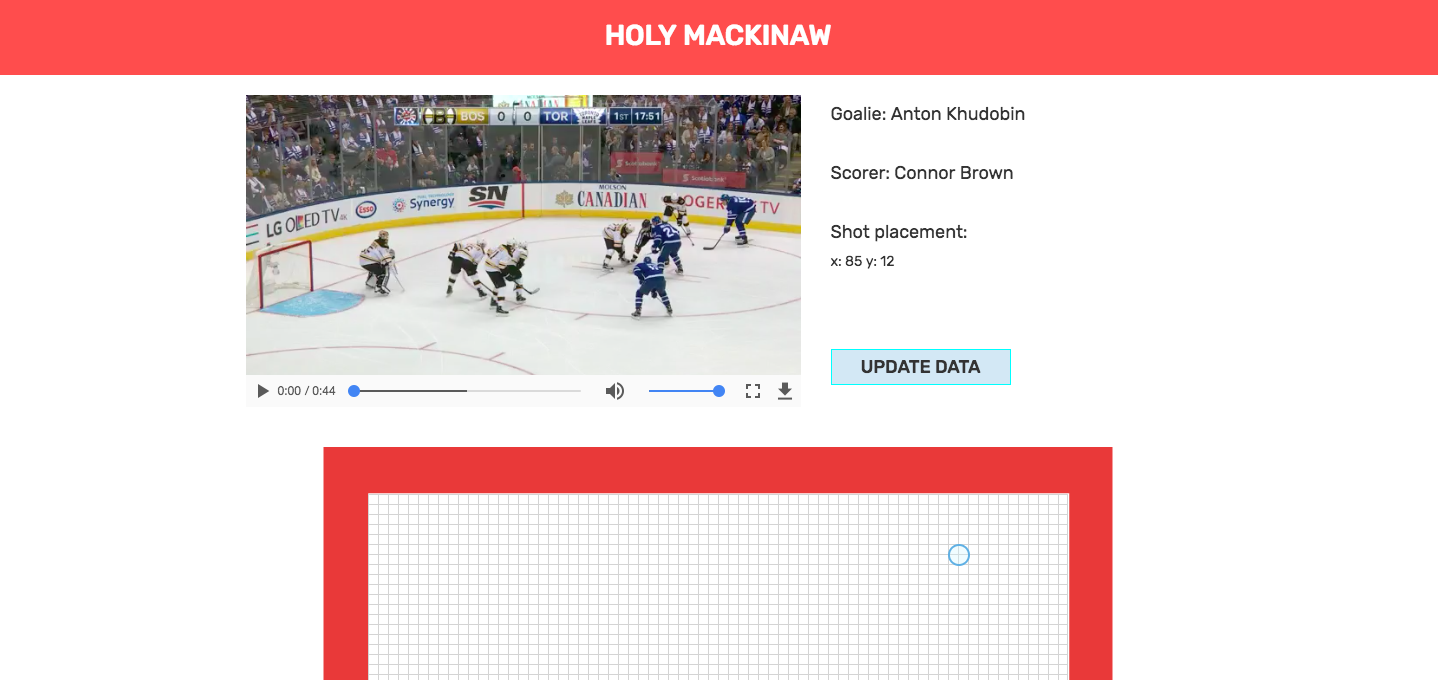
I built a system to help describe scoring plays in hockey in hopes of understanding highly complex and random events. Interactive elements were used that allows a user to describe video, that includes both passes, player position, and goalie weaknesses.
Technology
- Database to store scoring play data with MongoDB
- Express.js was used to create a lightweight API for interacting with the database
- Uses d3.js to build interactive system for describing plays

Koala Testers
Website unavailable koalatesters.com
Description
Koala Testers was built alongside the Heist Design team to quickly prototype a product that would help both internal and external design firms with their design process. User feedback is critical to the design process, this tool aims to make the user feedback loop quick and easy.
Technology
- jQuery to keep interactions and animation simple accross browsers
- SASS variables to build a consistant style for elements
- Grid system: boostrap
Global Hockey
100-years-leafsDescription
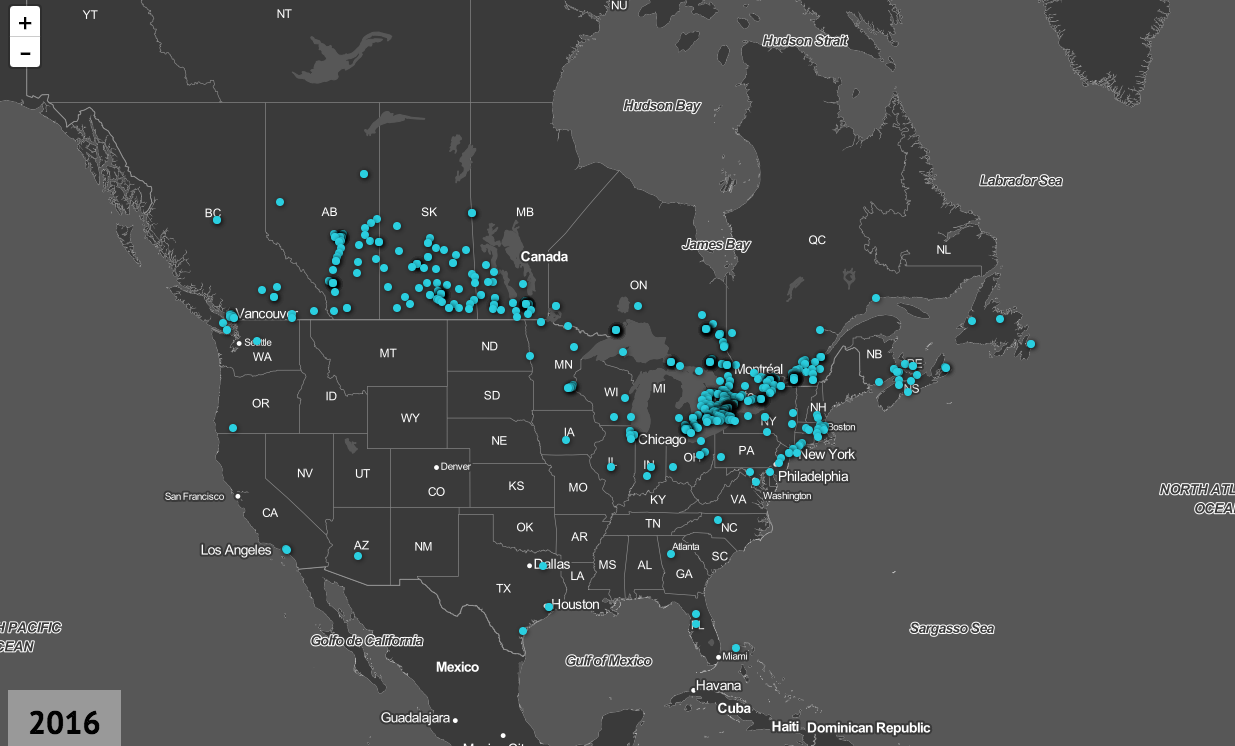
Built as a personal project, I wanted to understand how hockey has grown globally over 100 years of the NHL. With 1000+ players I scraped and plotted all Leafs players birth cities over the franchise's history.
Technology
- Node.js and MongoDB were used to scrape and store data
- Google's reverse-geocode API was used to find lat/long of each player's birth city
- Leaflet.js was then used to render lat/long on a map
React Formation
react-formationDescription
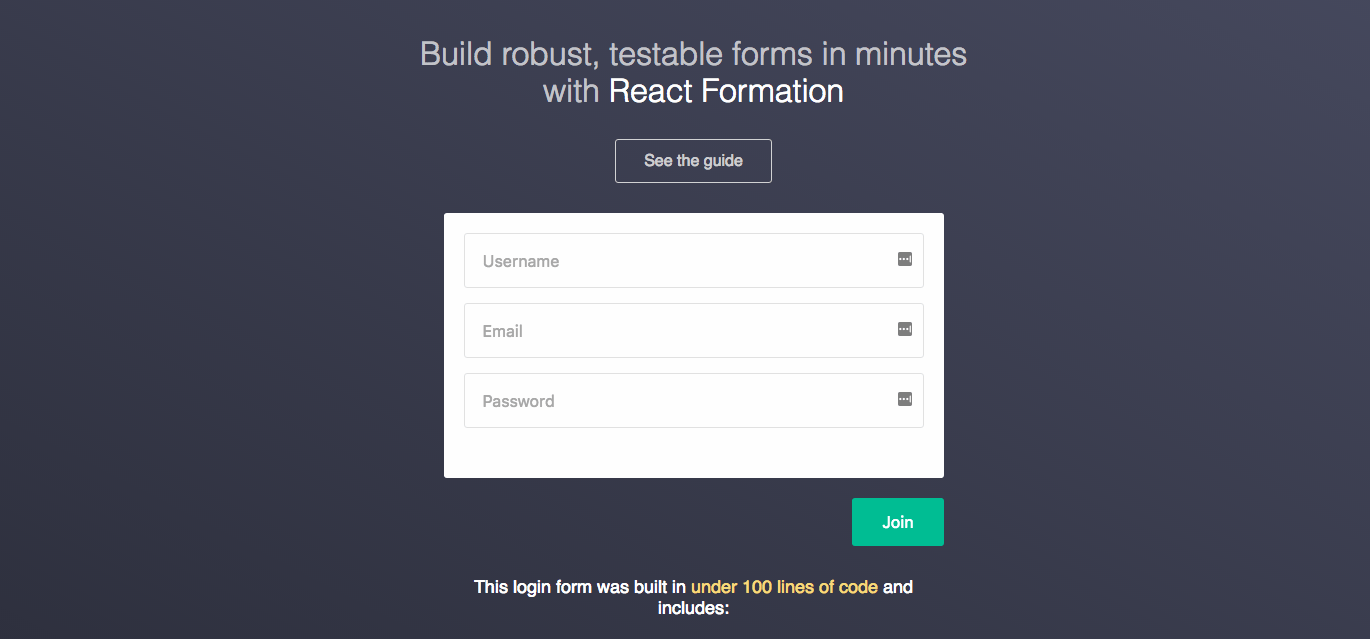
A friend and I wanted to make building forms with React simpler, so we a made small React library to do just that. The library makes implementating forms easy, and with just a few dozen lines of code includes validation and A/B testing.
Technology
- React for component based views
- npm scripts for optimized development
- Mocha.js for unit testing
Drive Dashboard
drive-dashboardDescription
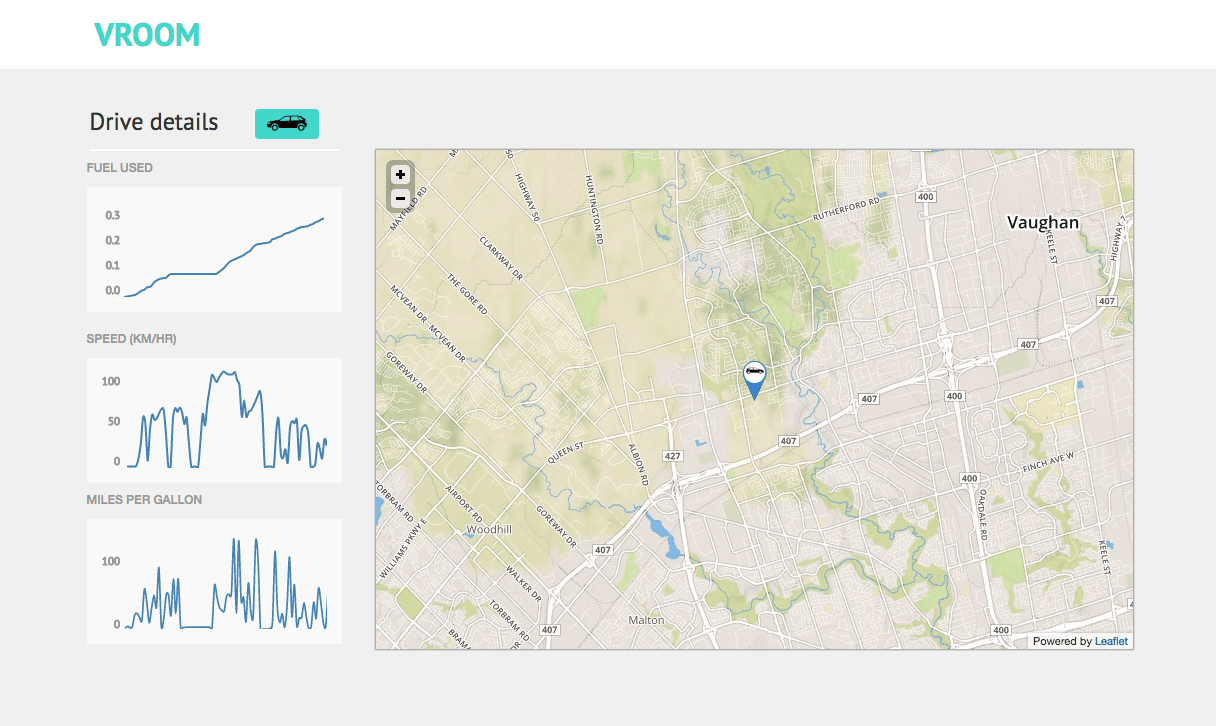
I wanted to explore some car data a friend had given me as a quick interface to understand a route.
Technology
- Uses d3.js for animating line charts
- Uses Leaflet.js for mapping and driving animation
Get Headlines
get-headlinesDescription
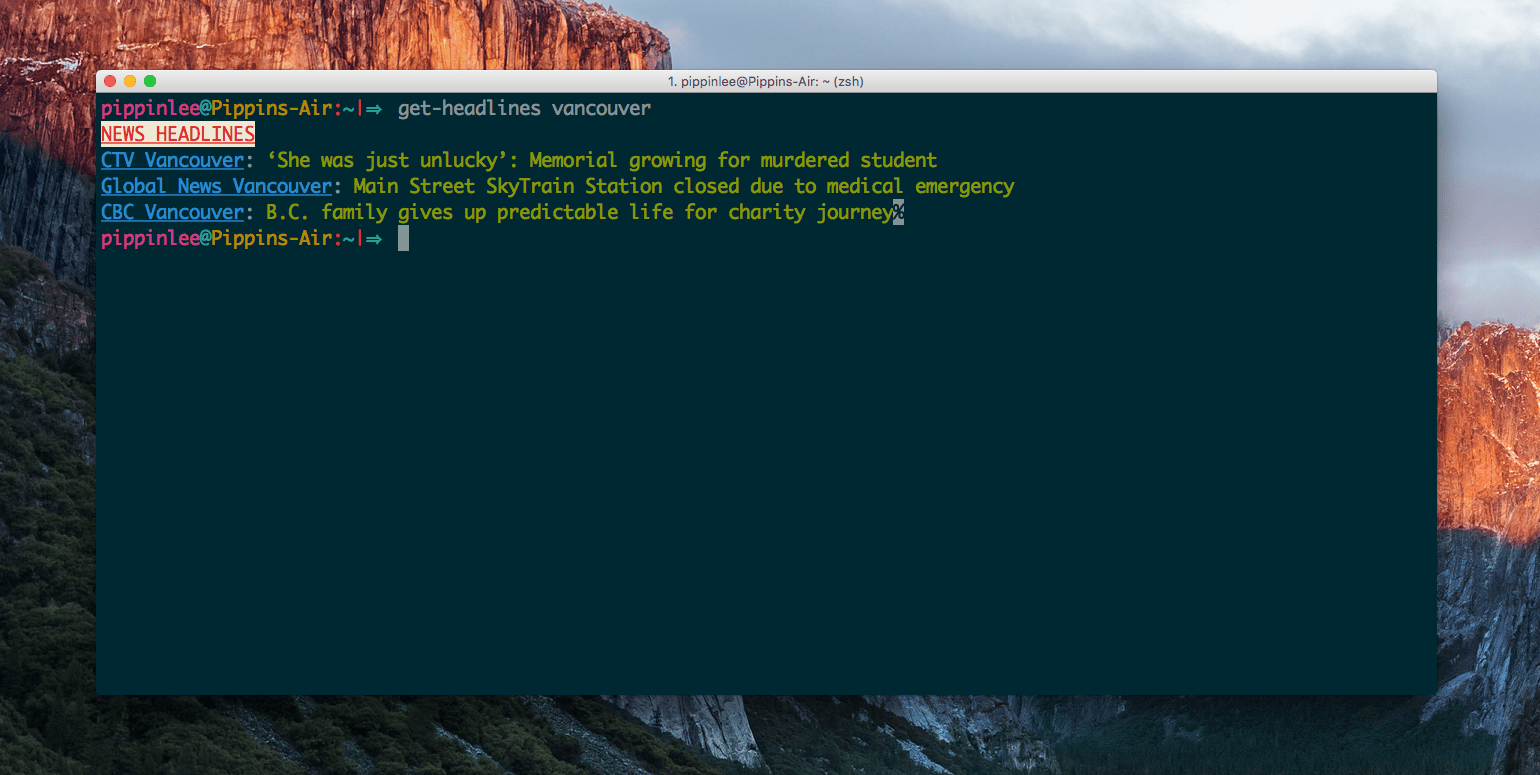
I started by asking what would change about our relationship to different regions if we could know what is happening. I made this small command line tool that given a city, goes to the different news websites of that region and outputs the latests headlines.
Technology
- Using Node.js to scrape data from different news sites
- Distributed on npm
- Used as part of simple local news API
Sunshine List
yorku-sunshineDescription
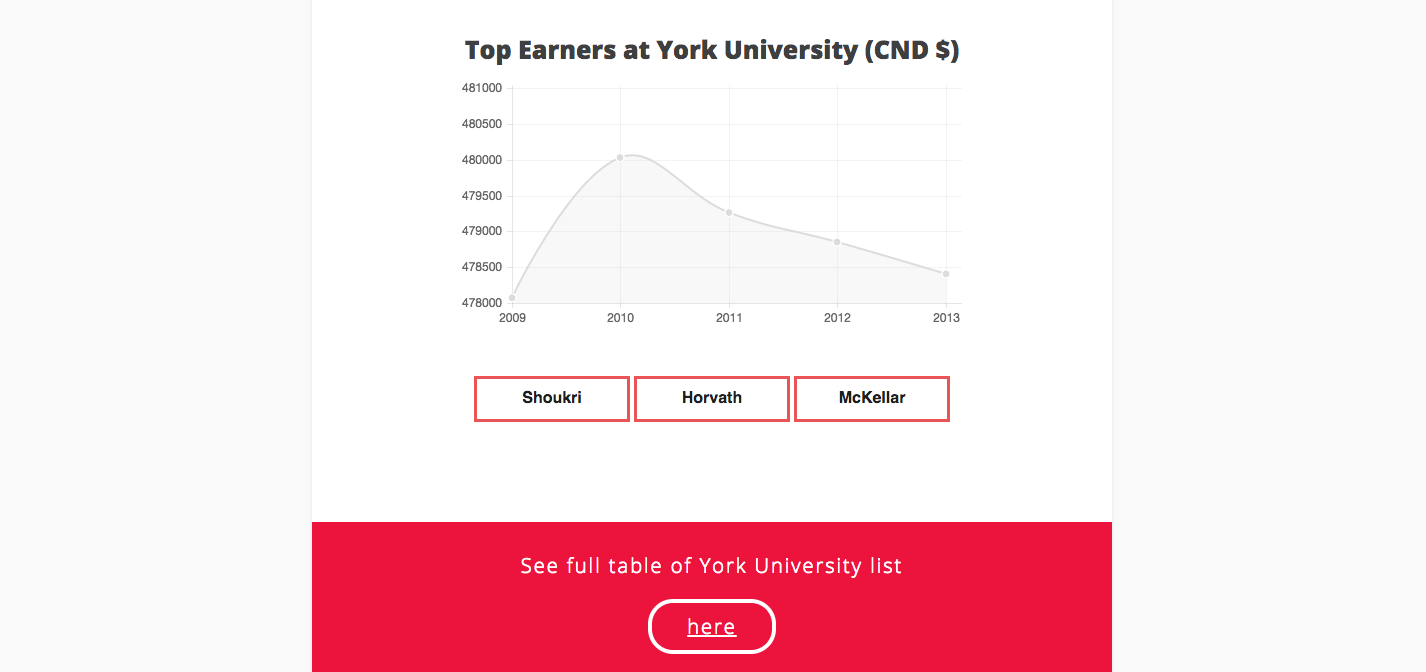
Every year the Canadian government must disclose the university staff that earn more than $100,000. This was made for an article in the student paper to show the trends and gender breakdown.
Technology
- Data was scraped using a small module called scraperJS that makes querying the DOM simple
- jQuery and Dynatable were used to display the data

Ghana World Cup
ghana-cupDescription
I had a collection of photos and audio from when I covered the world cup events in Toronto. Using popcorn.js I was able to create a unique story that captures the happy choas of the Ghanese community in Toronto during the World Cup.
Technology
- Uses Popcorn.js to cue audio and images by frame